National Drink Beer Day
Beer is the most popular adult beverage consumed in the world. National Drink Beer Day is observed annually on September 28th. This day is about appreciating the craftsmanship that beer promotes. Great ways to celebrate include indulging in your favorite local beer with family or friends, discovering a new favorite, or toasting bartenders and brewers.
Beer Varieties
In celebration of National Drink Beer Day, it’s worth noting that there’s a beer for every palate, whether it’s an ale, lager, or stout. Additionally, non-alcoholic (NA) beer varieties have recently gained popularity, offering a more inclusive option for those who prefer NA choices. The resemblance between some alcoholic and NA beers is undoubtedly uncanny, while others show little resemblance at all.

Alcoholic vs. Non-alcoholic Beers:
A Case Study
In a previous study (AppNote 250), GERSTEL scientists analyzed these alcoholic and NA beers to extract the volatile organic compounds (VOCs) responsible for similarities and differences in flavor. This was accomplished using immersive Twister® stir bars and Thin Film Solid Phase Microextraction (TF-SPME) devices in combination with Gas Chromatography-Olfactometry/Mass Spectrometry (GC-O/MS). The Benefits of Twister®/TF-SPME for VOC and sVOC Extraction
Immersive Twister®/TF-SPME is a reliable and solvent-less method for extracting volatile and semi-volatile compounds from aqueous matrices like beer. The benefits include:Lower detection limits than traditional methods (e.g. SPME)– due to the extraction devices’ enhanced surface area and phase volume

Efficient extraction of a broad range of compounds– due to the TF-SPME membrane, coated with polydimethylsiloxane (PDMS) and hydrophilic-lipophilic balanced (HLB) particles

 Sample Preparation and Extraction
In this study, GERSTEL scientists analyzed six beers. Three alcoholic beers and their non-alcoholic equivalents were the samples of choice: a pilsner, stout, and India Pale Ale (IPA). Approximately 10 mL of alcoholic and non-alcoholic beers were pipetted into separate 10 mL screw-capped vials. A Twister® stir bar was immersed in each vial, and a PDMS/HLB TF-SPME membrane was attached to a holder and placed in the vial. The samples were extracted for 1 hour at room temperature. Alcoholic vs. Non-Alcoholic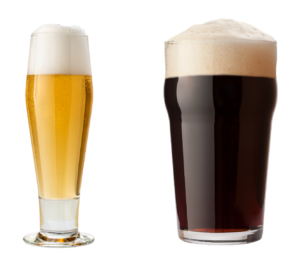 Pilsners and Stouts
The alcoholic pilsner used in this study was dealcoholized using vacuum distillation. The abundance of a few essential flavor compounds decreased in the NA pilsner. To remedy this, the brewers added flavorings prepared in food-grade propylene glycol and glycerin to mimic the original alcoholic pilsner’s flavor profile. The method for removing ethanol from the alcoholic stout, cold filtration, was most successful. This was reflected in the resulting alcoholic and NA stout chromatographic profiles, where the abundance of several flavor compounds was comparable.
 Alcoholic vs. Non-Alcoholic IPAs
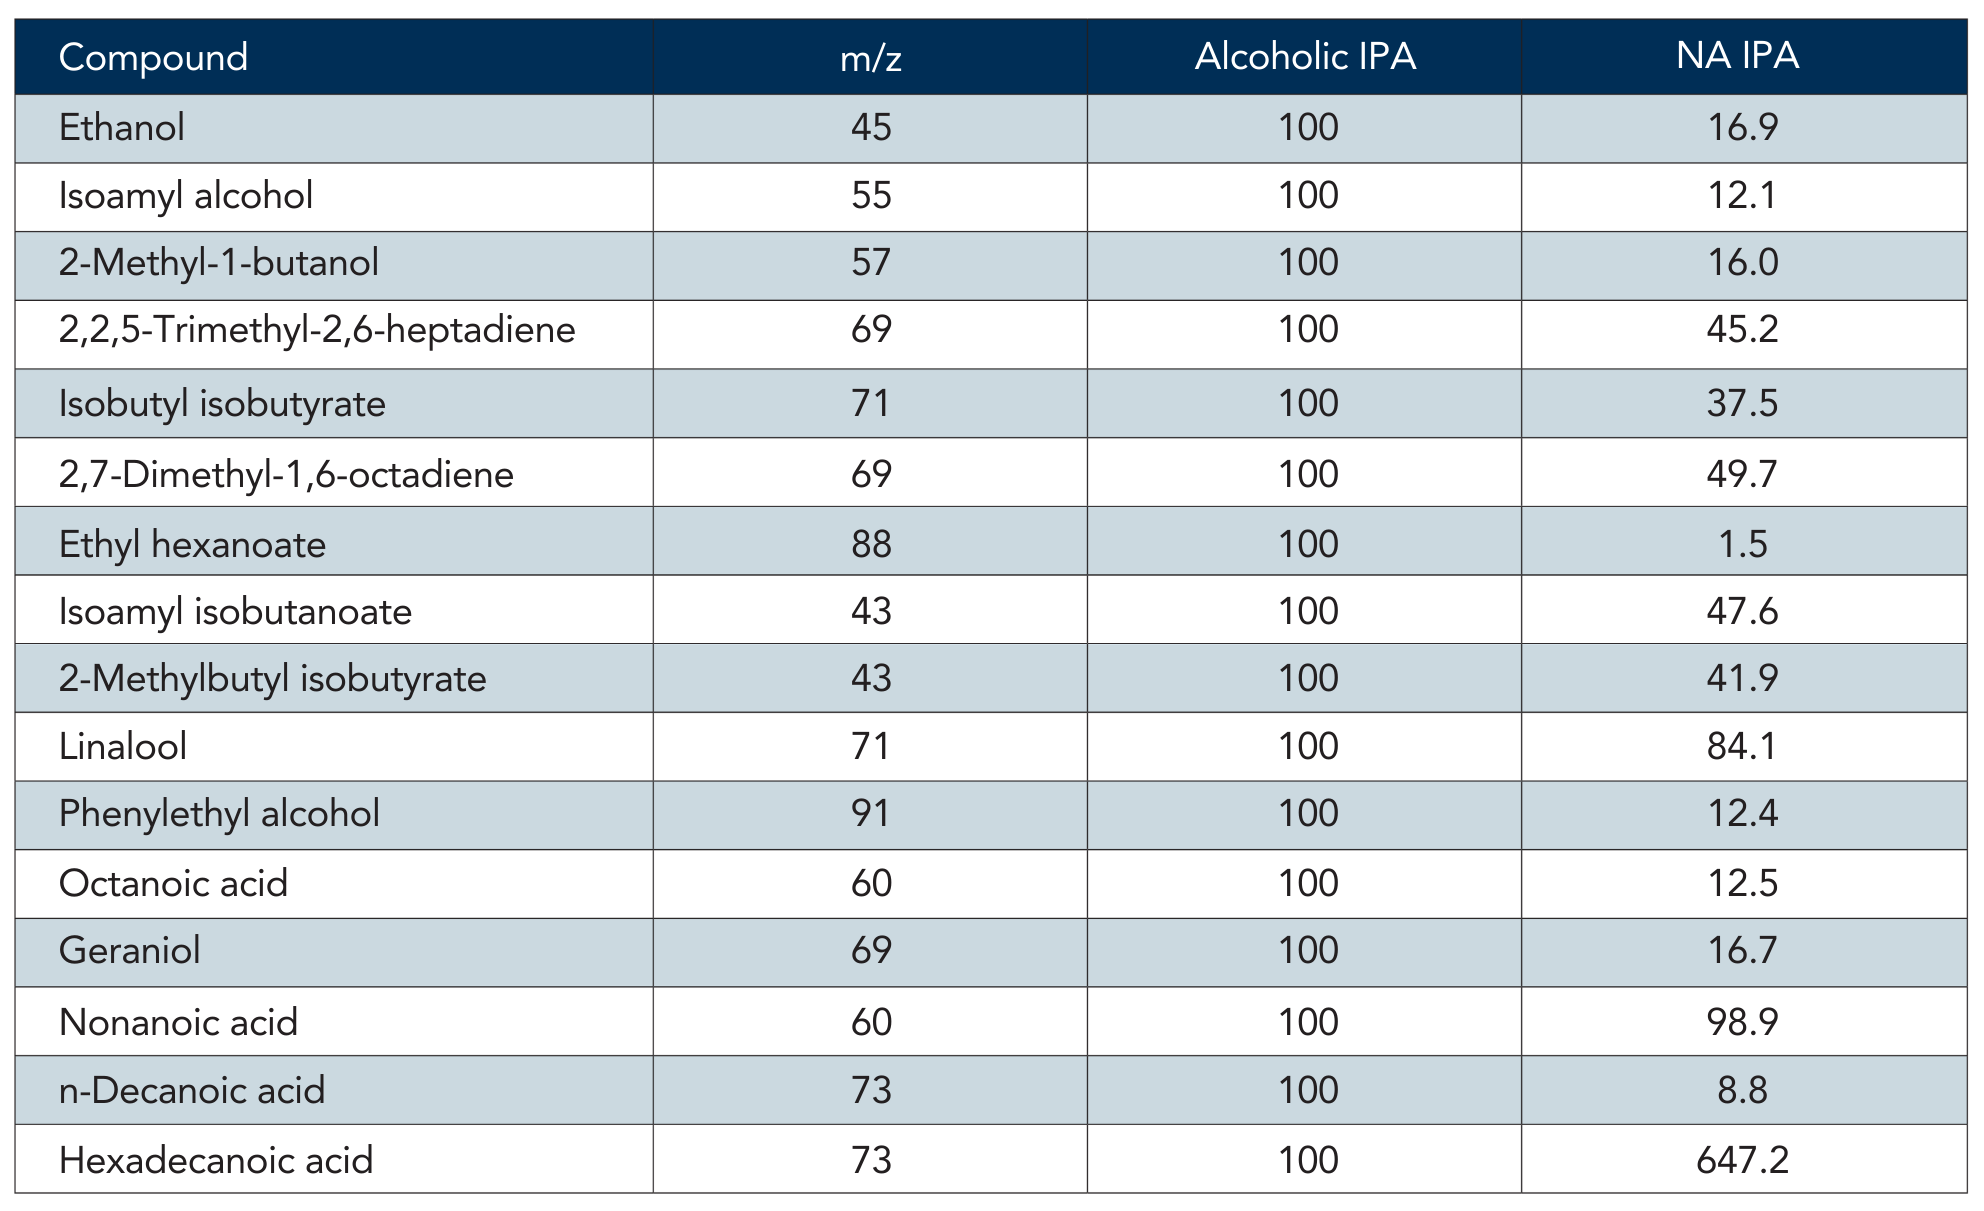
The Twister/TF-SPME extraction of the alcoholic and non-alcoholic (NA) IPAs revealed significant differences between the two. The alcoholic IPA was fermented to less than 0.5% ethanol by volume. In the NA IPA, essential esters, acids, and terpenes were notably diminished. These compounds were, however, abundantly present in the alcoholic IPA, thus contributing to its flavor profile. Interestingly, new compounds were detected in the NA IPA, likely added by the brewer to emulate the flavor profile of its alcoholic counterpart.
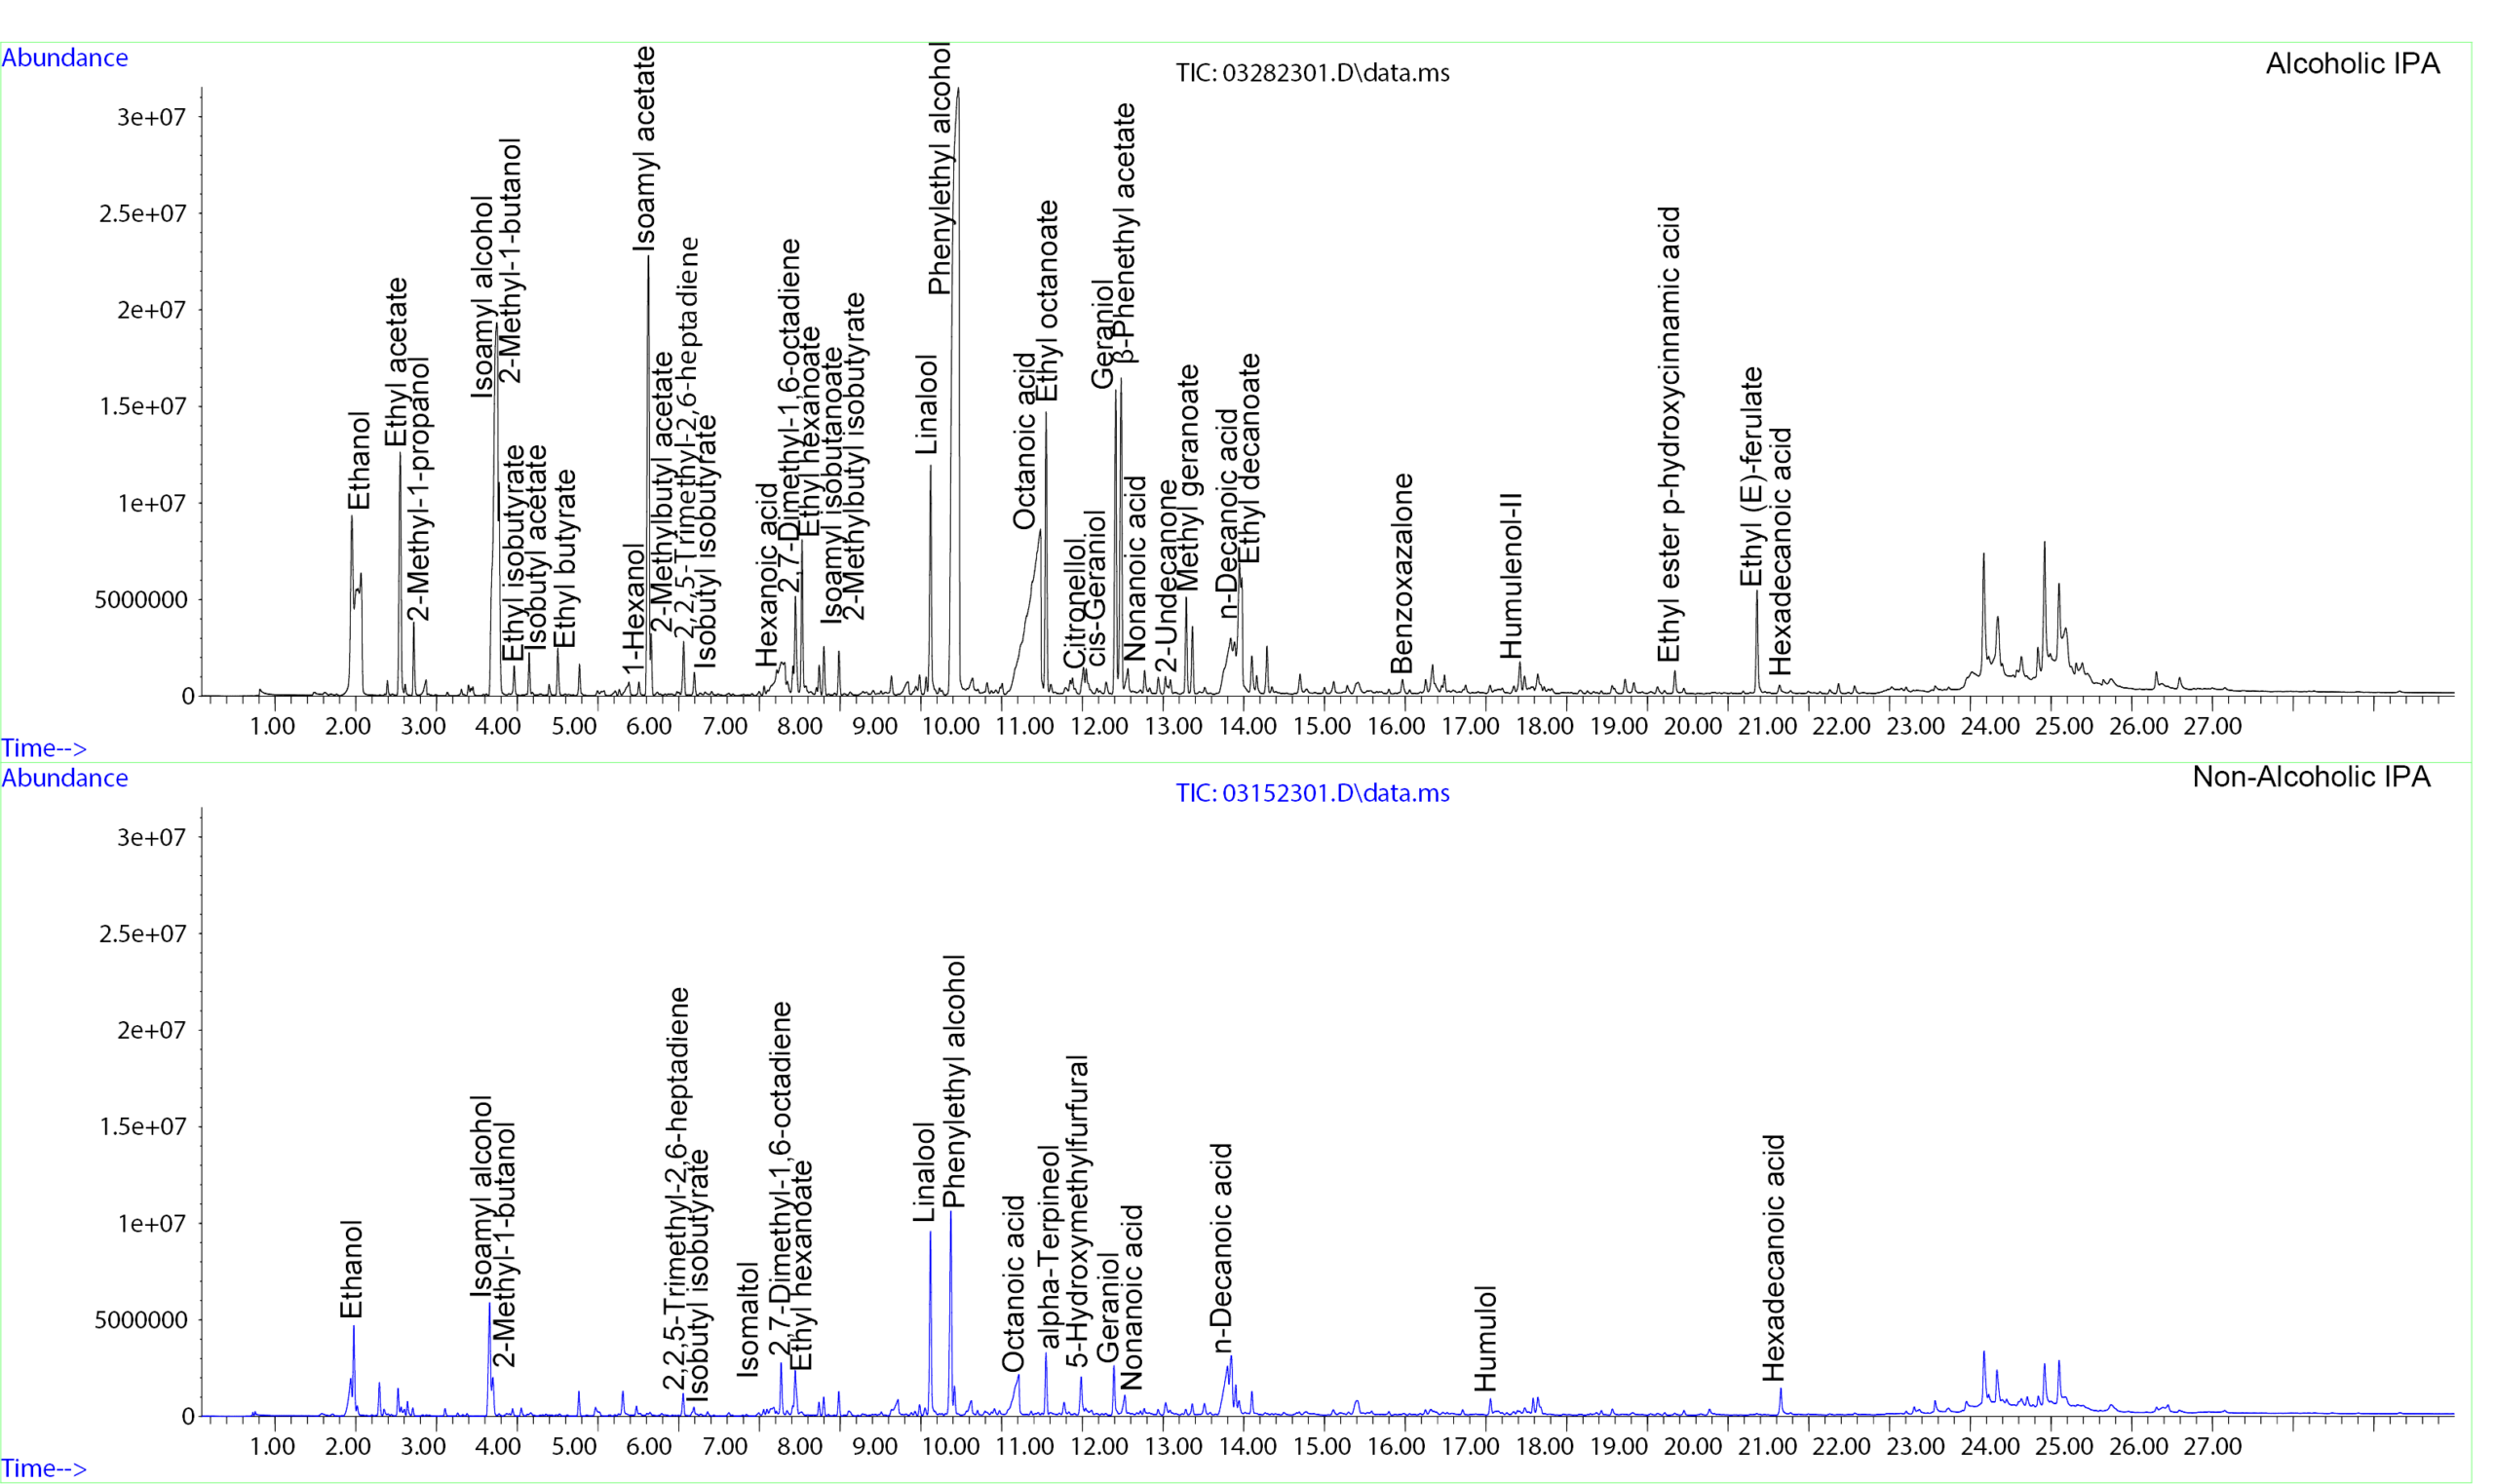
A closer look reveals that nearly all esters, acids, and terpenes showed reduced peak areas in the NA IPA when normalized to the alcoholic IPA.
Sensory Evaluation: Investigating Flavor Differences
Since the NA IPA differed the most from its alcoholic equivalent, this beer was chosen to investigate sensory differences further using GC-O/MS. First, two panelists evaluated the alcoholic and NA IPAs side-by-side. The panelists determined that an onion-like flavor was present in the NA variety but not the alcoholic.
Olfactory Detection
When both sample extracts were introduced and detected at the Olfactory Detection Port (ODP 4), the sensory data showed several retention time regions where the odor descriptors differed due to the dealcoholization process of the NA IPA. Moreover, an odor region described as “sweaty, body odor, and red onion” was only detected in the NA IPA and matched the odor described in the original sensory panel.
Odor Identification
The subsequent odor did not correlate with a detectable peak, so GERSTEL’s ODP 4 trapping capabilities were utilized to selectively trap this odor region five times onto a sorbent-filled tube and increase analyte mass on column. After the tube was reintroduced via GC-O/MS, a small peak was visible and identified as 3E-hexenoic acid.

Study Conclusions
There were clear sensory differences between the alcoholic IPA and NA IPA, all of which stem from the dealcoholization technique. Other brewers may succeed more using alternative dealcoholization approaches that aim to preserve the original flavor profile of alcoholic varieties. AppNote 250 shows that the other two samples, pilsner and stout, more effectively proved the latter.
Cheers!
As glasses rise in honor of National Drink Beer Day, let the celebration include the rich spectrum of flavors that both alcoholic and NA beers have to offer. Perhaps even indulge in a similar side-by-side tasting to appreciate the nuances, subtle or not, and the science behind it all!
